- Home
- About Albany Data Stories
- Albany's AIM Funding
- Albany's Budget 2017-2025
- Albany's Vendors
- Albany's Population
- Albany's Poverty
- Albany's Taxable Property
- Albany's Developable Land
- Albany's Vacant Buildings
- Albany's Housing
- Albany's LowInc Housing
- Albany's APD Complaints
- Albany Crime Reports Pt 1
- Albany Crime Reports Pt 2
- Albany's Speed Cams Pt 1
- Albany Speed Cam Contract
- Albany's PILOT program
- Albany's Financial State
- Albany's Finances - 2024
- Albany's Mayoral Election
- Albany's Auditor Election
- Alb County v City Finance
- Albany's Mayoral Spending
- Albany's 2026 Budget, Pt1
- Albany's 2026 Budget, Pt2
- Albany's FOIL Responses
- Albany's Pedestrian Crash
- Albany's Open Data
- Albany's Parking Tickets
- Albany's Audit Savings PR
- Albany's City Salaries
- Albany's Rooftop Solar
- Albany's InclusiveHousing
- Albany's Property Taxes
- Albany's Fiscal Stress
- Albany's ResProperty Tax
- What's Next
What insight is in the Albany Police DEPT's complaints data?
The Albany Police Department (APD) publishes many statistics and visualizations on openAlbany, more than half of all listings originate from the APD and they represent the most current data found on openAlbany.
There are several datasets related to citizen complaints and we wanted to explore those datasets to understand what we can learn. The APD posts a data file of all citizen complaints dating back to 2009 (there is some additional data from prior years but it is not significant). In addition, there is a month-by-month visualization here.


We downloaded the citizen complaint data file and began exploring it. The data is very straightforward. There are 5 columns of data - a case number, a type of complaint, a date, and allegation and a count (which is always=1). There are two values for “Type”: Citizen Complaints are initiated by the public and Administrative Investigations are generated within the Police Department.
Analysis by year
We did a small amount of cleaning, deleting any records prior to 2009 and some other invalid data.
This left 7,223 complaints recorded between 2009-2024. We can view complaints by year, including both citizen complaints and internal administrative investigations. 2010 had the highest number of complaints (845) and 2018 is the full year with the lowest number of complaints (198). Note that 2024 includes only 9 months of complaints data.

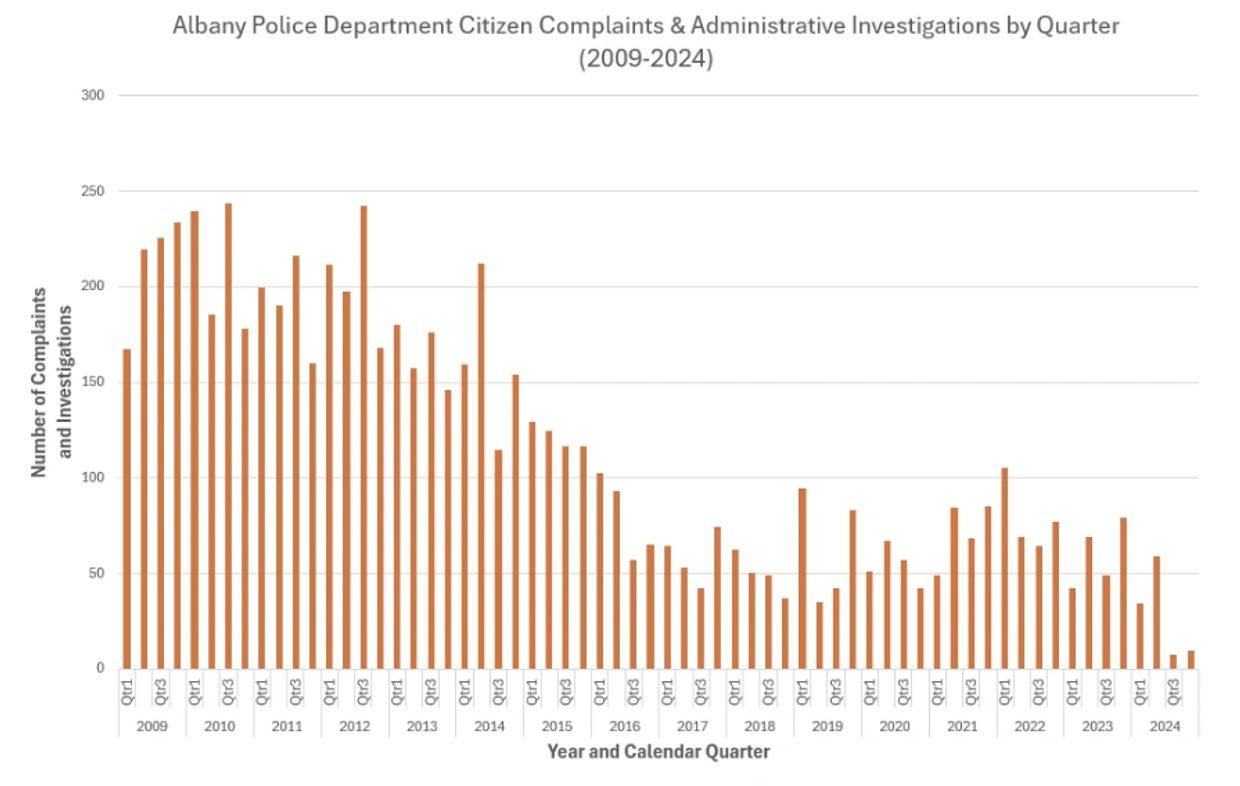
all complaints by quarter
We started to graph out the data for 2009-2024 regardless of type of complaint. We wanted to avoid the lumpiness of month-to-month analysis so we chose to analyze by year & quarter. For example, in the graph below for Q3 2009 (the months July-September 2009) there were 225 citizen complaints (the third bar from the left).
Between the graph and the yearly statistics table above, the data suggests a drop in overall complaints, with a dramatic drop between 2012 to 2018.

administrative investigations by quarter
We wanted to pull apart the two types of complaints - Citizen Complaints and Administrative Investigations. We started graphing Administrative Investigations which you will recall are generated internal to the Police Department. Graphing the number of Administrative Investigations by quarter shows a trend similar to that of all complaints.

citizen complaints by quarter
Lastly, we graphed Citizen Complaints (issues initiated by the public). We generally see the same trends as the previous graphs, however there are more spikes or surges in citizen reports. For example, in 2014 the reports by quarter are:
- Q1 (January to March) - 24 citizen complaints
- Q2 (April to June) - 69 citizen complaints
- Q3 (July to September) - 16 citizen complaints
- Q4 (October to December) - 45 citizen complaints
analyzing allegations coding
Administrative investigation by type of allegation

In an effort to better understand the data and identify additional trends we analyzed the “Allegations”. The “Allegations” field provides additional detail on the complaint or issue.
We only looked at the Allegations data between 2020-2024; prior Allegations data was frequently freeform (e.g. “CO alleges that the officer put handcuffs on him and tightened them for over a period of 45 minutes”) and not specifically categorized.
Citizen complaint by type of allegation

Looking at just the Administrative investigations between 2020-2024 there were 979 Administrative investigations. 64 of the Administrative investigations (7%) were coded with an Allegation; the remaining 93% of Administrative investigations were blank (not coded). We can review the coding of the Administrative investigation Allegations in the table below. “Off Duty Conduct” was the most frequent Allegation value.
Reviewing the Citizen Complaints between 2020-2024 there were 187 Citizen Complaints. 50 of the Citizen Complaints (27%) were coded with an Allegation; the remaining 73% of Citizen Complaints were blank (not coded).